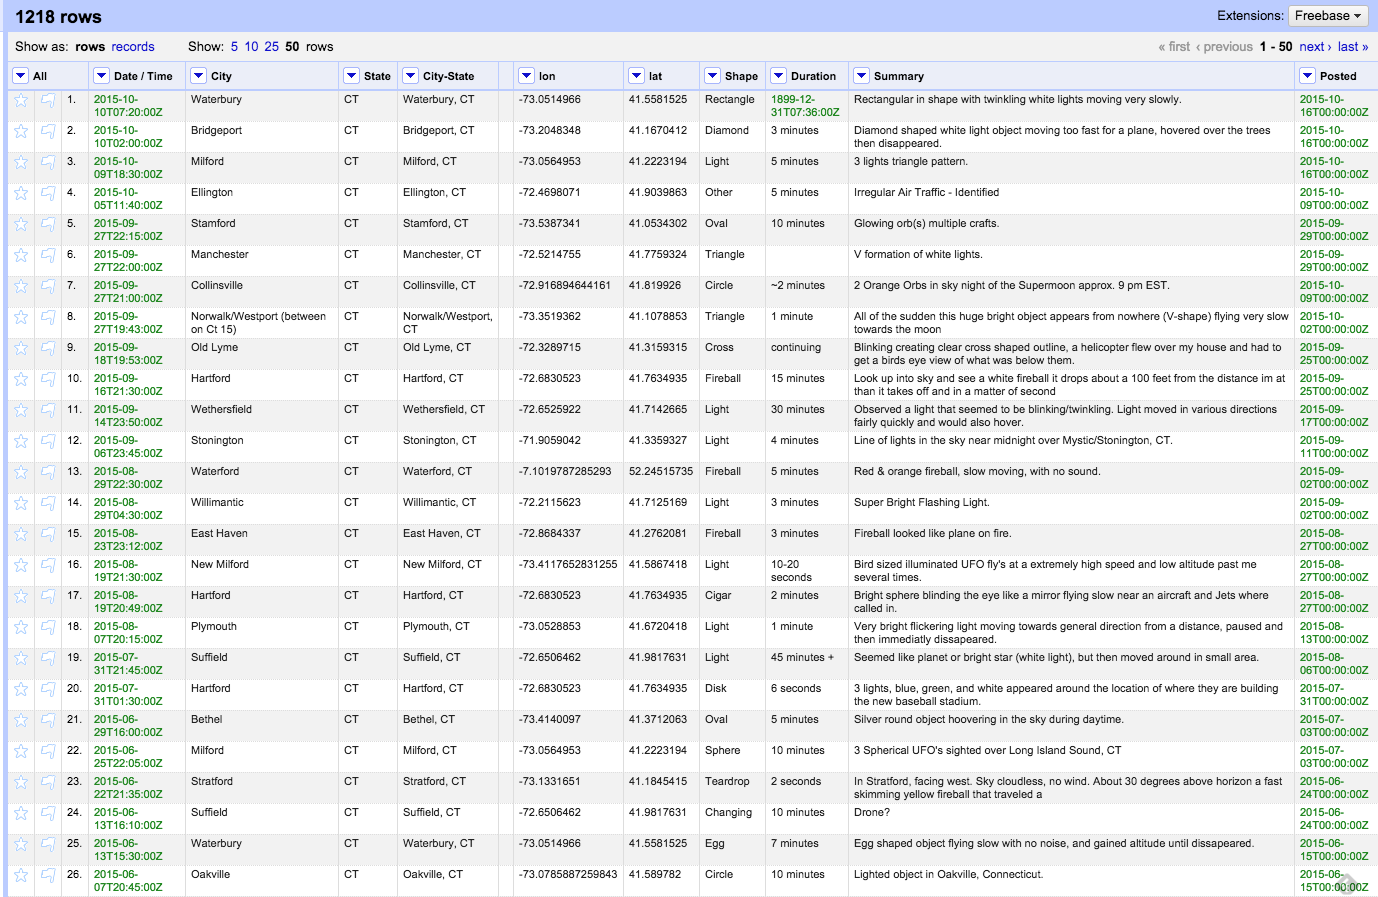
Step One: Grab Data
To pull down data, navigate to the National UFO Reporting Center and select a state of interest. We will select Connecticut because this workshop is happening in New Haven, and it's interesting to see.
The easiest way to clean the data is to import it into Excel, use text-to-columns on the Data tab to get the data to look good, and spot-check the data for irregularities. When I did this for Connecticut, it took me about 30-40 minutes to do basic data cleaning for 1200 rows.
Had I wanted to do more, I could:
- Standardize the way duration is coded in the Excel file to make it machine-readable.
- Check city names to ensure that they all match locations that are actually in Connecticut.
And I
would have done that if I needed to get this data analysis-ready. Los Angeles, CT, for example, does not exist. You'll notice that I never did, and that's because it's easier for me to teach from dirty data than from completely clean data.
Step Two: Geocode Address Information
Once you have edited the data in Excel, save it as a .csv, .tsv, or Excel workbook. I chose to save this data as an Excel workbook because OpenRefine can read Excel files, and the commas and oddities in the data set makes it risky to use commas or tabs as delimiters.
To make the data readable for geoprocessing, we need to combine the city and state fields. Select the drop-down chevron on the State Column, Choose Edit > Add Column Based on This Column, and use the formula cells["City"].value + ", " + cells["State"].value to combine the cities and states.
Once we have that, we can make a call to an API for geocoding. If you use the Google Maps API, you can only put your map in Google Maps — and we're not going to do that. For our purposes, we can use the OpenStreetMap MapQuest API. You will need to apply for a developer's license on the MapQuest API web site to receive a unique user key, and they will allow several thousand unique geocoding calls per month. To avoid maxing out the quota, I recommend testing on sample data sets.
Select the drop-down chevron for the combined City-State column and add a column based on this column. This is the command needed for geocoding: 'http://open.mapquestapi.com/nominatim/v1/search.php?' + 'key=INSERTKEYHERE&format=json&' + 'q=' + escape(value, 'url')
— because it's an API call, you will need to add a time delay of 100-200ms between each call so that you are not throttled. This is an API best practice.
A lot of stuff will come back at you. We just want the latitudes and longitudes. "Add Column Based on This Column" is what we will use on the API-called field we made — and we will use it twice, once for latitude, and once for longitude. This will pull the value for lat or long out of the first record that the JSON query brought back. (And a side note: This might not be what we wanted! You will see when we try to map this data. Remember, we just wanted CT data points!) These are the two piece of code you will use to make a column for latitude and a column for longitude: value.parseJson()[0].latvalue.parseJson()[0].lon
After that is done, collapse the column for the JSON gibberish and export the non-collapsed columns. Now we have data that we can pull into mapping tools!
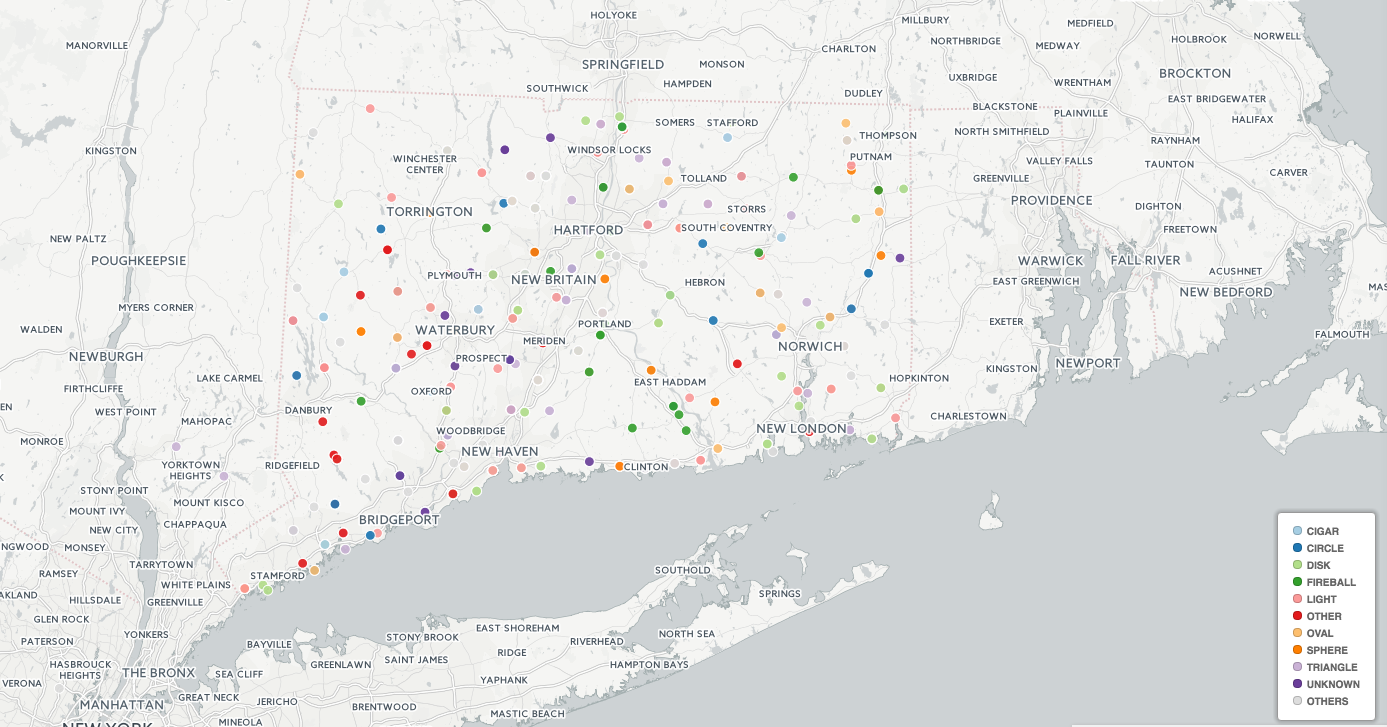
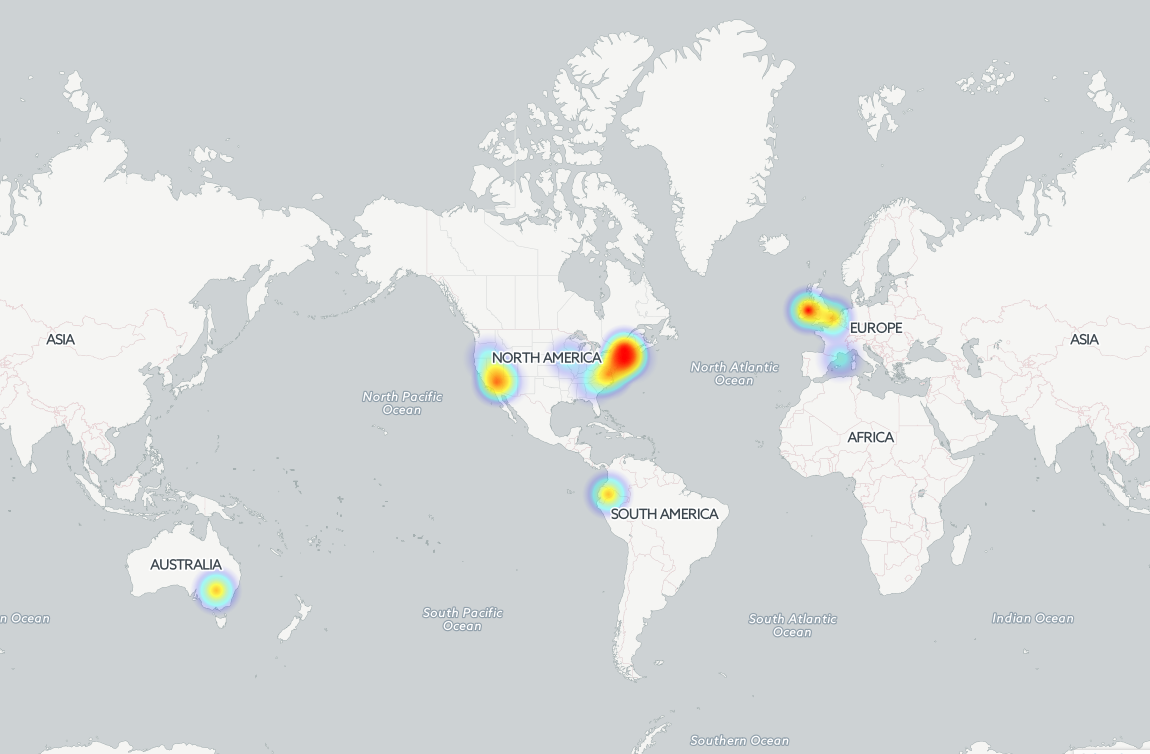
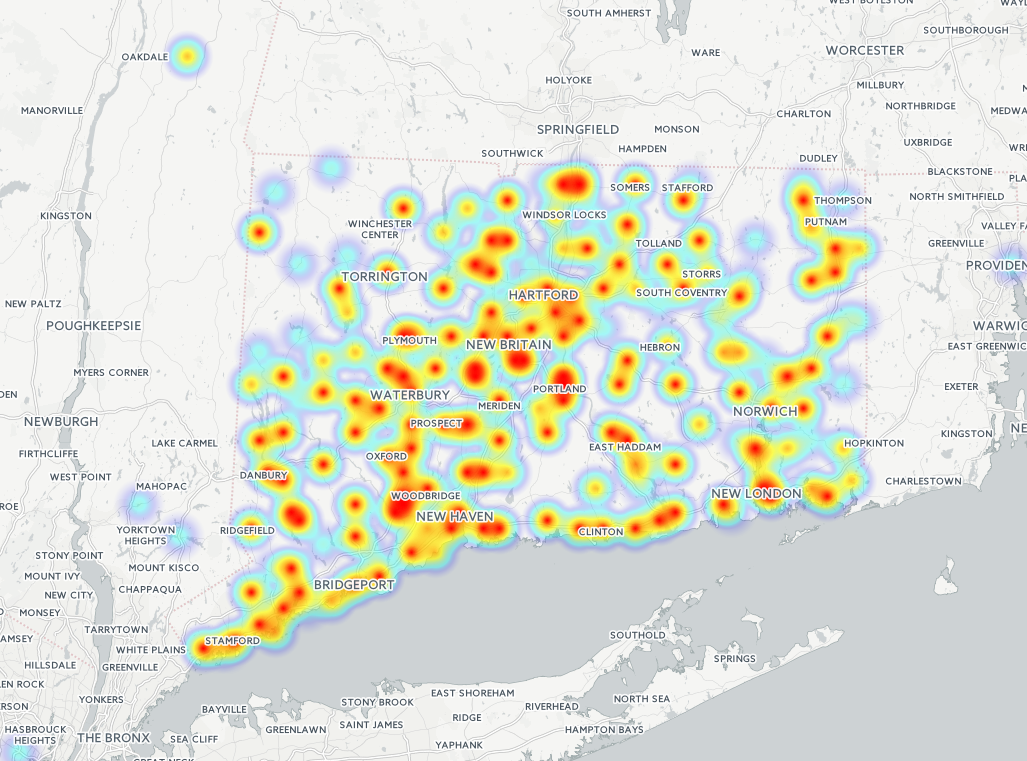
Step Three: Use CartoDB to Visualize the Data
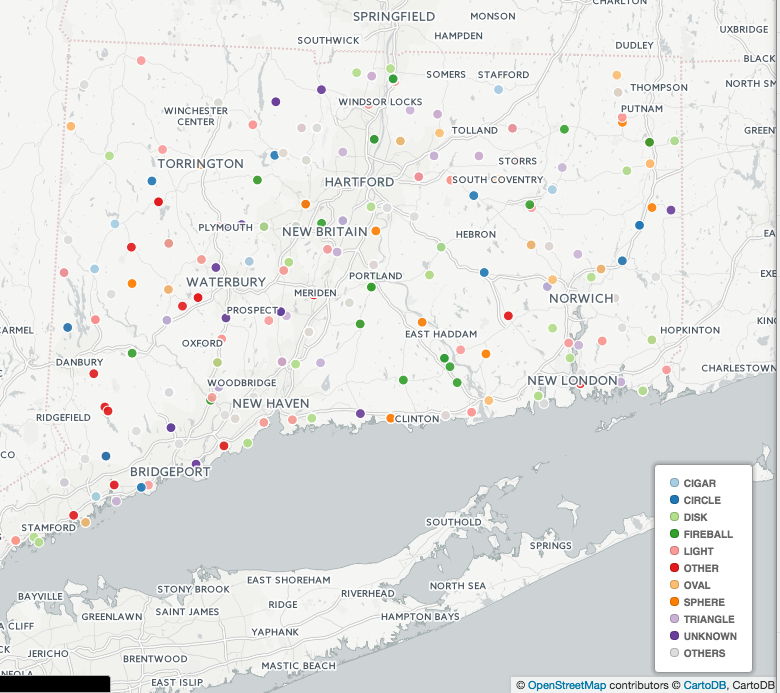
Map it! You can make some really interesting visualizations in places like CartoDB — just sign up for an account. Here is some of the stuff that I did. Note that there are addresses represented that are not exactly in Connecticut. This happened in part because there are some towns in the data set (e.g., Los Angeles, CT) that don't exist. In other cases, the first result in the JSON query when we geocoded was not a location within Connecticut. CartoDB gives you the opportunity to create heat maps, but we can also classify the points based on image type to see what the distribution of UFO features might be.
I have also made an interactive map on CartoDB that you can look at. It is animated — we can see when the sightings happened over time! See the map here.
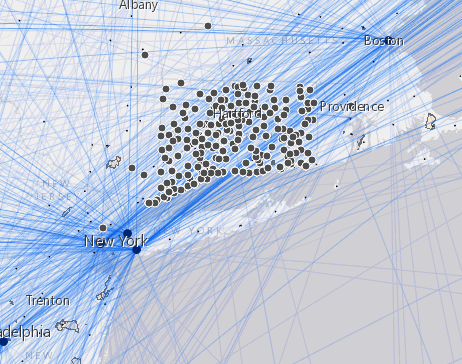
Step Four: Use ArcGIS Online to Mash Up
and Visualize the Data
ArcGIS Online (for which you will need an account) will let you import up to a certain number of records. To compare data after uploading files to ArcGIS Online, you can find data sets that have been made available on the platform. For UFO data, we can be creative: I decided to pull down data about wetlands (e.g., swamp gas?), flight paths, and US military bases to see if there was a correlation. Of course, to do a proper analysis, this would need to go into ArcMap, where we could analyze the data points.